

In a follow-up work [2] to our LISH approach [1] we investigated how the LISH approach performs in cases where the input space is high-dimensional. The analysis of high-dimensional data spaces is accompanied by a number of problems that are commonly referred to as the “curse of dimensionality” [4]. In this context a major problem is that the ability to discriminate data points by their relative distances diminishes with increasing dimensionality [5]. To observe the impact of different distance measures on the GNG and the local input space histograms we use the Minkowski distance in our analysis with varying values p for its exponent. By choosing the Minkowski distance a range of popular distance measures can be covered: for p = 1 it is equivalent to the Manhattan distance, for p = 2 it is equivalent to the Euclidian distance , and for p → ∞ it approaches the Chebyshev distance.
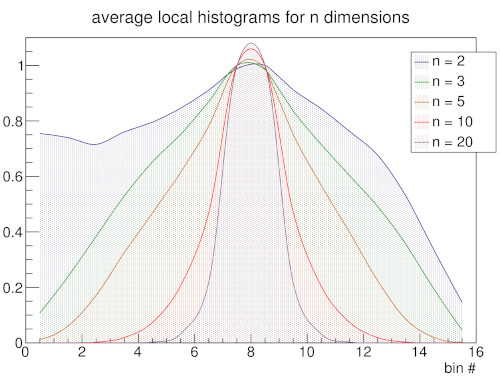
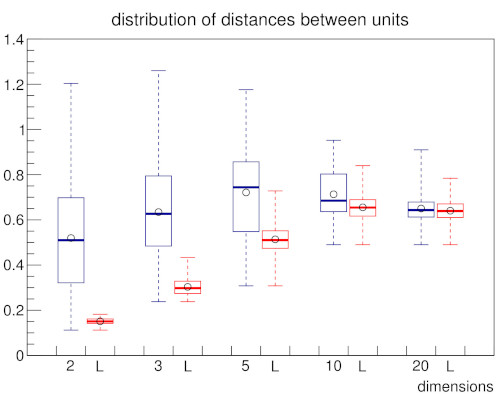
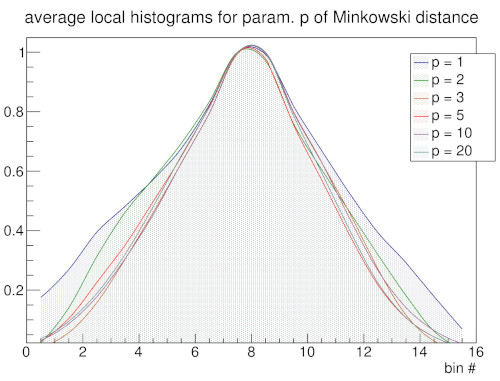
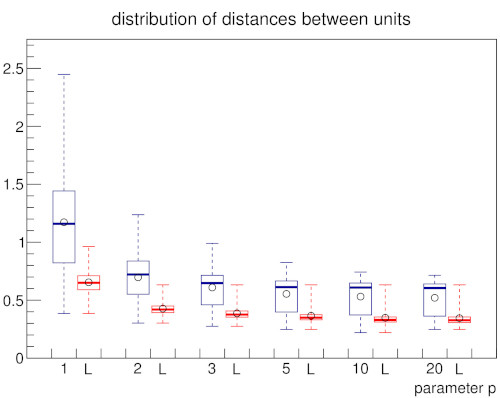
In order to establish a baseline on how the appearance of the local input space histograms changes with respect to either a dense or a sparse input space and varying parameter p of the Minkowski distance a set of experiments using random input data was conducted. With increasing dimension n the GNG has to cover an exponentially growing volume of input space with a constant number of units. Similarly, the constant number of inputs is uniformly spread across this exponentially growing volume. As a consequence, the input space as represented by the constant number of input samples becomes increasingly sparse and the particular inputs to the GNG approach an equidistant position between their respective first and second closest units. Likewise, the distances between the GNG units themselves become more and more similar and the locality given by the GNG edges gets essentially lost as the distributions of pairwise distances between all units and the distributions of pairwise distances between connected units converge (Fig 3b). This dynamic is reflected in the shape of the local input space histograms (Fig 3a). Based on these results we tested the influence of the choosen distance measure in two scenarios with a dense and a sparse input space, respectively. The increase of parameter p leads in either scenario to a compression of distances between the GNG units similar to the effect caused by an increase of input space dimension (Fig. 3d, dense scenario shown; for sparse scenario see supplementary material). However, in case of a dense input space the locality given by the GNG edges stays intact with increasing values of p, i.e., the pairwise distances of connected units differ clearly from the pairwise distances between all units. The median value of all pairwise distances between the units gets pushed towards the upper quartile while the bulk of all pairwise distances between connected units stays below the lower quartile of distances between all units. This behavior can be explained by the fact that with increasing values of p differences between vectors that are only distributed across few vector components are emphasized whereas differences that are spread across many vector components are deemphasized. Thus, despite the absolute compression of distance values, the relative contrast between near and far distances of inputs that share a common closest unit actually improves with increasing values of p. The appearance of the local input space histograms is virtually unaffected by the described changes in the distance distributions as the distance ratio on which the histograms are based depends only on the relative distances between an input vector and its respective first and second closest units.
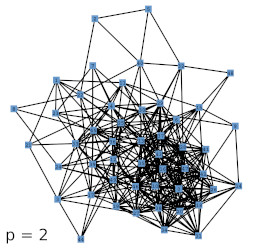
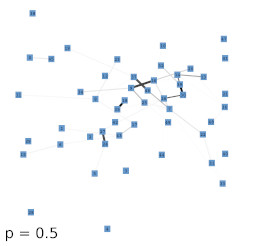
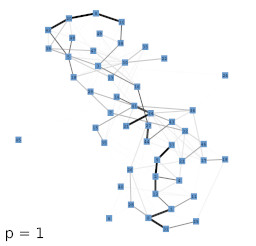
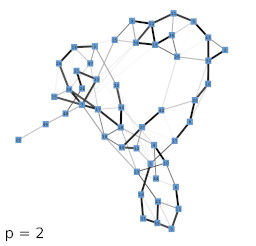
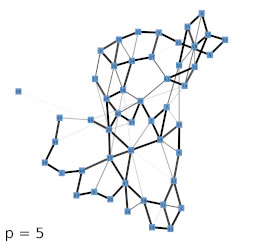
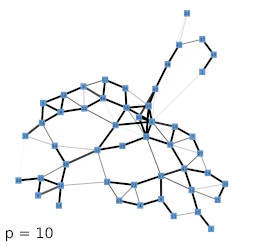
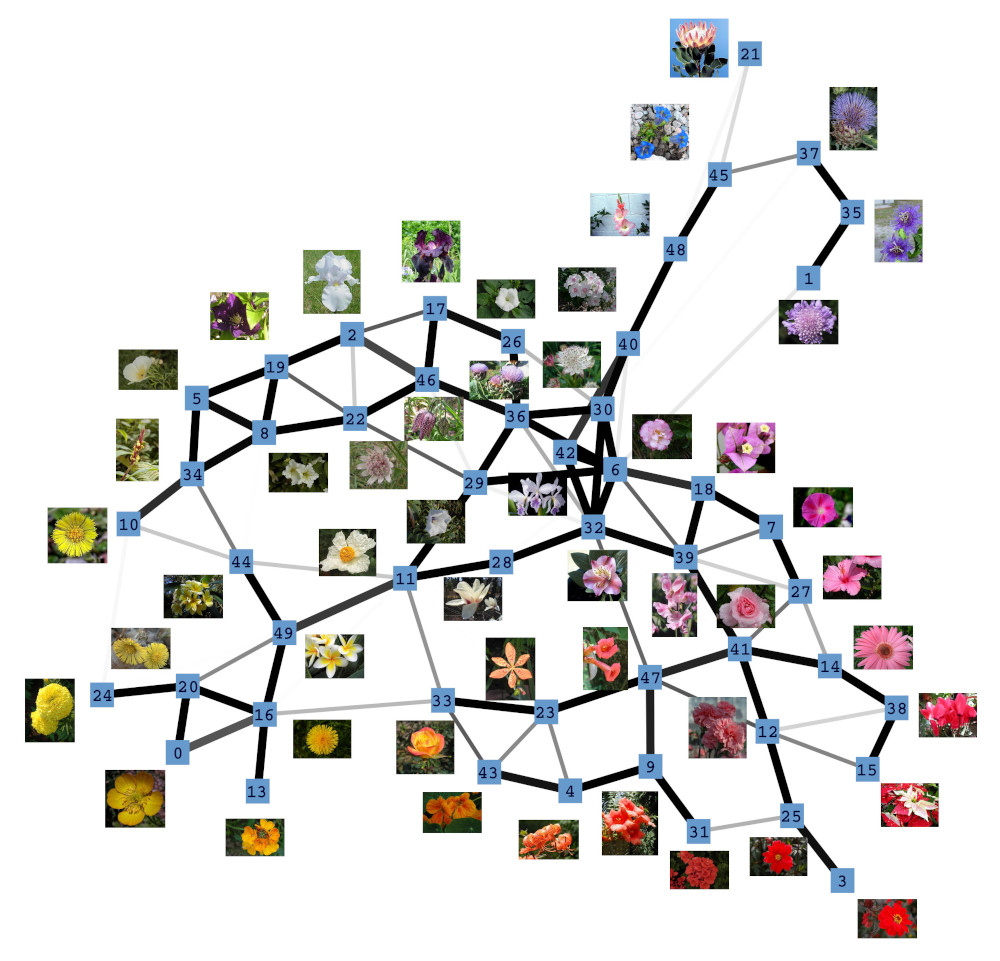
Next, we investigated the behavior of the LISH approach for high-dimensional data that contains a known, low-dimensional manifold. As test-data we chose 64-dimensional color histograms of images from a flower database. To visualize the results, we used a force-based graph drawing algorithm that used information derived from the LISHs to weigh the connections between the GNG units. The resulting graph drawings for GNGs with 50 units that received 64-dimensional color histogram input are shown in figure 4b-f. For comparison, figure 4a shows the result of the unmodified drawing algorithm. The drawings seem to support the previous observations that with increasing value of p the locality among neighboring units appears to increase as more and more units get connected by strong edges, i.e., edges that cover dense regions of the input space. To examine if the resulting structures are also semantically meaningful we mapped the images whose color histograms were closest to the prototypes of the GNG onto the graph drawing shown in figure 4f. The mapping shown in figure 5 demonstrates, that the strong edges selected on the basis of their local input space histograms indeed represent meaningful neighborhood relations.
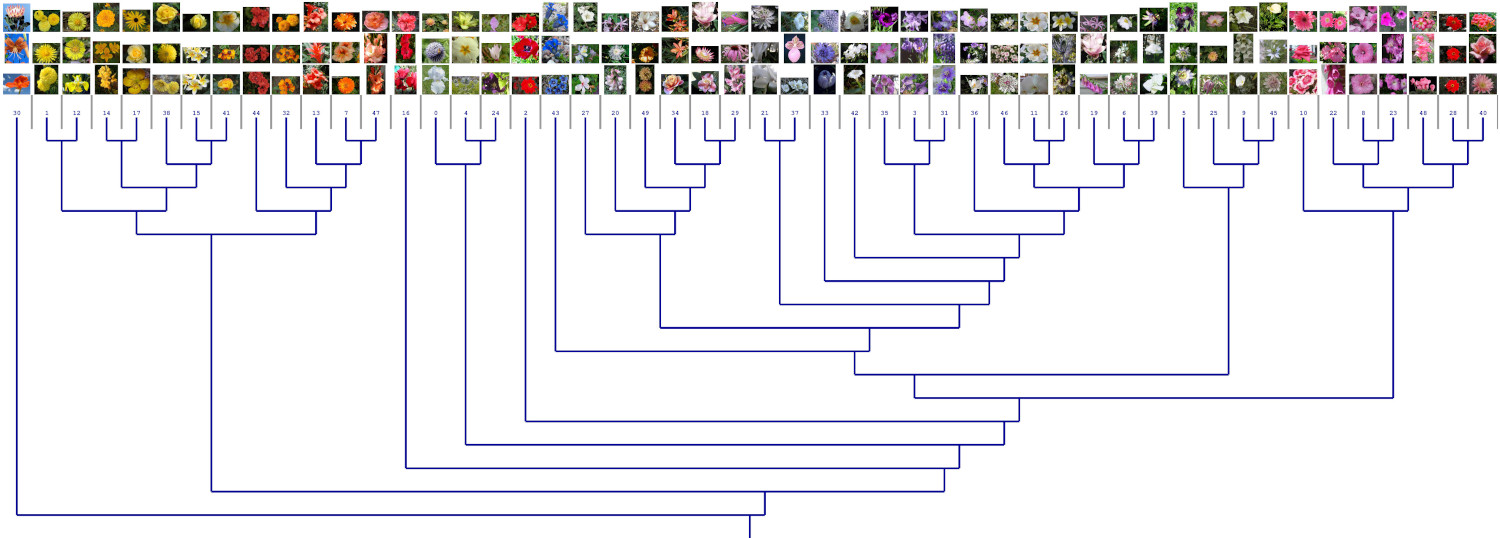
Analogous to the force-based graph drawing we tested the semantic meaningfulness of this approach by mapping the images whose color histograms were closest to the prototypes of the GNG onto the hierarchical clustering dendrogram of a GNG. The mapping shown in figure 6 illustrates, that in this case too the local input space histograms provide usefull information about the structure of the input space.
References
1
,
Supporting GNG-based clustering with local input space histograms,
In: Proceedings of the 22nd European Symposium on Artificial Neural Networks, Computational Intelligence and Machine Learning. Louvain-la-Neuve, Belgique, pp. 559–564, 2014,
[pdf|bibtex]
2
,
Analysis of high-dimensional data using local input space histograms,
In: Neurocomputing 169, pp. 272–280, 2015,
[pdf|doi|bibtex]
3
,
A Sparse Representation of High-Dimensional Input Spaces Based on an Augmented Growing Neural Gas,
In: GCAI 2016. 2nd Global Conference on Artificial Intelligence. Vol. 41. EPiC Series in Computing. EasyChair, pp. 303–313, 2016,
[pdf|doi|bibtex]
4
,
Clustering high-dimensional data: A survey on subspace clustering, pattern-based clustering, and correlation clustering,
In: ACM Trans. Knowl. Discov. Data 3 1:1–1:58, 2009,
[doi]
5
,
On the surprising behavior of distance metrics in high dimensional space,
In: Database Theory — ICDT 2001, Vol. 1973 of Lecture Notes in Computer Science, Springer Berlin Heidelberg, pp. 420–434, 2001,
[doi]